Thanks to AI, these three AI analytics apps are transforming the way we view data. These apps are leaving the complex spreadsheets for the gurus and creating charts and graphs that make it easy for the untrained to understand company financials and forecasts. These AI marketing tools are helping teams make informed business decisions.

Powerful AI data applications are not just simplifying spreadsheets; data visualization software means teams can quickly visualize data, assimilate it, and use it to make informed business decisions.
- Tellius. One app presents itself as an enterprise solution, demanding onboarding and customization. It has garnered excellent reviews for its customer support and enriching user experience.
- Thoughtspot. Another app offers business intelligence without the steep learning curves or the need for extensive onboarding. It stands out as more affordable and accessible compared to Tellius.
- Polymer. A particular app is celebrated for its affordability and ease of use, making it ideal for those who are not data scientists by trade but are passionate about crafting a compelling data story.
Here are three applications that are making it easy to convert data into storytelling
Tellius
Source: Tellius
Tellius is an advanced business intelligence platform that harnesses AI and machine learning to excel in data analytics. Its market share is expanding due to its intuitive interface, robust data visualization tools, and its proficiency in identifying trends within voluminous datasets.
-
- With Tellius’ natural language search capabilities, users can pose questions and receive data-driven answers. This feature makes the platform highly accessible to individuals who may not have extensive backgrounds in data analysis.
- Tellius excels in data transformation, streamlining the process to prepare data for insightful analysis. Users can create interactive dashboards and craft informative reports, turning raw data into actionable insights.
- The final step with Tellius involves crafting graphs and charts, the key visual storytelling tools in data presentation. Like its AI counterparts, Tellius simplifies the data analysis process, making it more accessible and efficient.
Tellius identifies that legacy systems fall short when it comes to scalability, often unable to provide the real-time metrics that marketers require to make informed decisions.
Pros
-
- Tellius offers robust data solutions that streamline sales, marketing, and operations tasks, transforming what was once a laborious manual effort into a seamless process for generating comprehensive reports.
- Tellius has garnered positive reviews for their customer service, with users describing their engagement as ‘highly engaged’ and their customer experience as ‘fantastic,’ appreciating the patience and support during the demo process and system implementation.
- Tellius is heralded as a ‘great futuristic product‘ that stands a notch ahead on the maturity curve when compared to its competitors, showcasing its advanced capabilities in the market.
Cons
-
- Industry limitations: Tellius supports pharmaceuticals, finances, consumer goods, and tech industries.
- Onboarding for a team can take time and may require customization.
- Limitations when using multiple data sources to create data visualizations.
Pricing
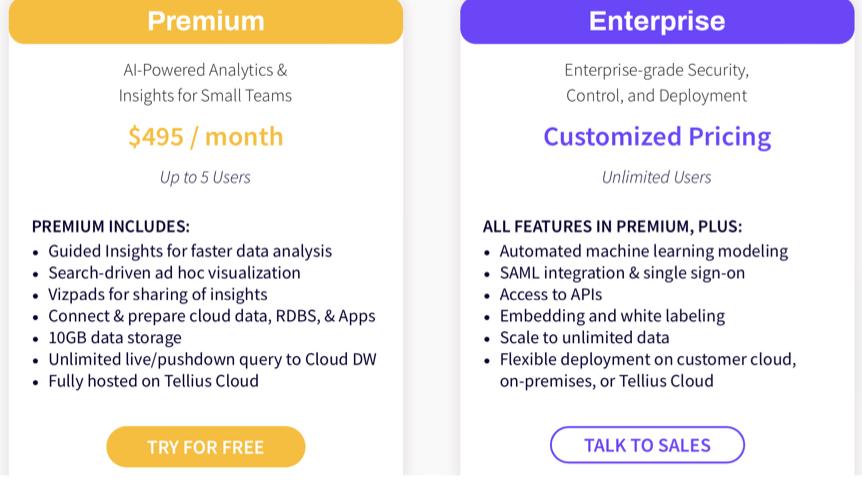
It’s important to note that there is no free trial for Tellius. Interested established companies must schedule a demo with their team to explore how this serious application aids in report generation and data-driven forecasting.
Thoughtspot
Source: ThoughtSpot
Designed for nontechnical data teams, Thoughtspot offers a platform for querying data with the ease of self-service analytics. This tool simplifies business intelligence, eliminating the need for complex learning curves and extensive onboarding processes.
“the only AI-powered analytics platform built for humans.”
Leveraging large language models, Thoughtspot transforms the way business data is analyzed and understood. You can embark on a free trial, no credit card required, to discover the capabilities of this innovative AI app firsthand.
Thoughtspot’s unique approach to data analytics stands out from competitors like Tellius. Not only does it offer a cutting-edge AI marketing app, but it also paints the big picture of data through additional resources like podcasts and blogs.
They delve into pressing topics such as ‘Our product vision for analytics in the age of AI‘ and ‘Security and risk mitigation in an LLM world’, offering valuable data insights. A tour of their platform showcases the simplicity of manipulating data to uncover diverse insights.
With ThoughtSpot, everyone’s a winner. It’s the:
-
- Self-service experience business teams want
- Code-first interface data teams love
- Embedded insights your customers need.
Catering to a broad community, Thoughtspot serves various sectors including startups, banking, financial services, retail, manufacturing, healthcare, media and communications, and the public sector. This diversity underscores its versatility and widespread applicability.
Pros
-
- While not fully realized yet, the prospect of integration with GPT for Thoughtspot is promising. The pace of product improvements is brisk, with anticipation building for the release of customized charts.
- ThoughtSpot stands out among AI data applications by offering unparalleled flexibility and ease of use, setting a new standard in the industry.
- The combination of usability, speed, and design in ThoughtSpot provides the fastest method for data access, allowing users to drill down through information with unprecedented efficiency.
Cons
-
- The phrase ‘Not there yet’ is a recurring theme in reviews, often followed by the suggestion to ‘come back in six months’, highlighting the importance of ongoing feedback.
- Overall experience was mediocre, including installation and onboarding.
- The product currently lacks advanced analytics and features that are standard among competing products, indicating a gap in its market offering.
Pricing
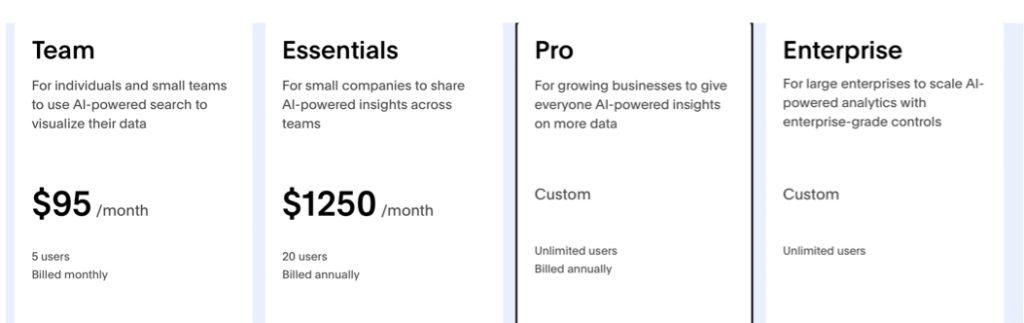
Polymer
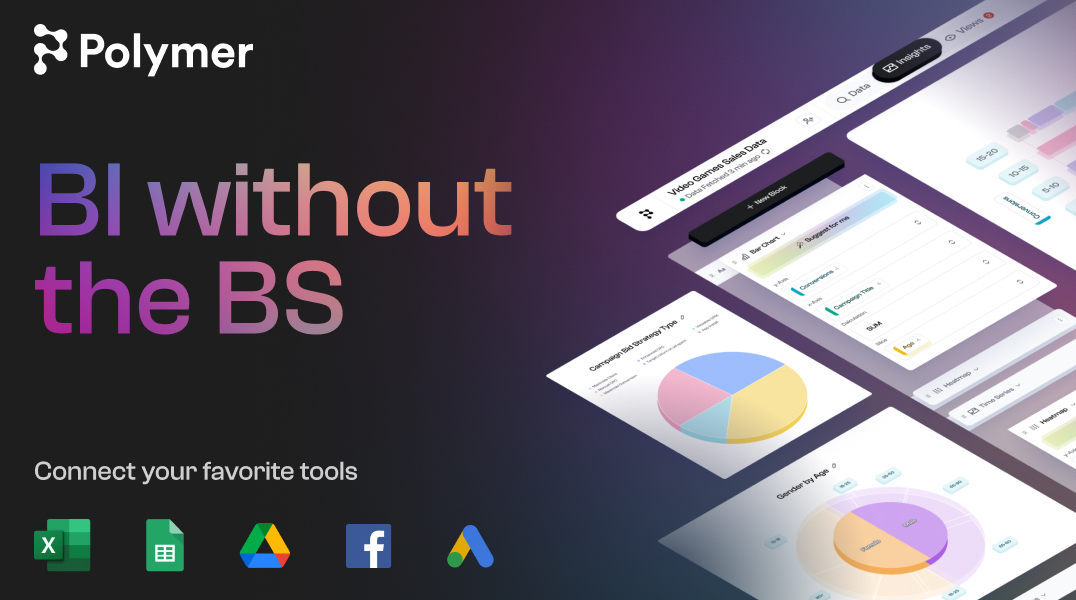
As a leading AI analytics tool, Polymer excels in data storytelling and is renowned for its ease of use, requiring no coding from users. It efficiently analyzes your data and recommends various dashboards to best present your metrics.
Polymer offers a wealth of free templates for Google Ads, Facebook Ads, Google Analytics, SEO, and sales KPIs, among others. These dashboards are pivotal for tracking essential marketing metrics, and Polymer simplifies the process of selecting a template, connecting your data, and crafting a personalized marketing dashboard.
I imported an old csv list from a Constant Contact mailing
Initially uncertain about the contents of a file in my download folder, I utilized Polymer to shed light on its potential. The platform swiftly generated pie charts, delineating data on subscribers, unsubscribers, and their associated lists. Further experimentation with bar charts and data manipulation revealed Polymer’s user-friendly interface and versatility.
Pros
-
- When faced with the challenge of creating data visualizations, my go-to solution would be a tool like Polymer, especially since I’m not a data scientist.
- There’s an excellent video tutorial that explains how to use Polymer.
- Polymer is targeting enterprise organizations, ecommerce and marketing teams. That’s a broad demographic field.
- Polymer has earned the trust of prominent enterprise technology companies such as Facebook, HP, and Spotify. Since its inception in 2019, Polymer has successfully secured $4m USD in funding, underscoring its growth and potential.
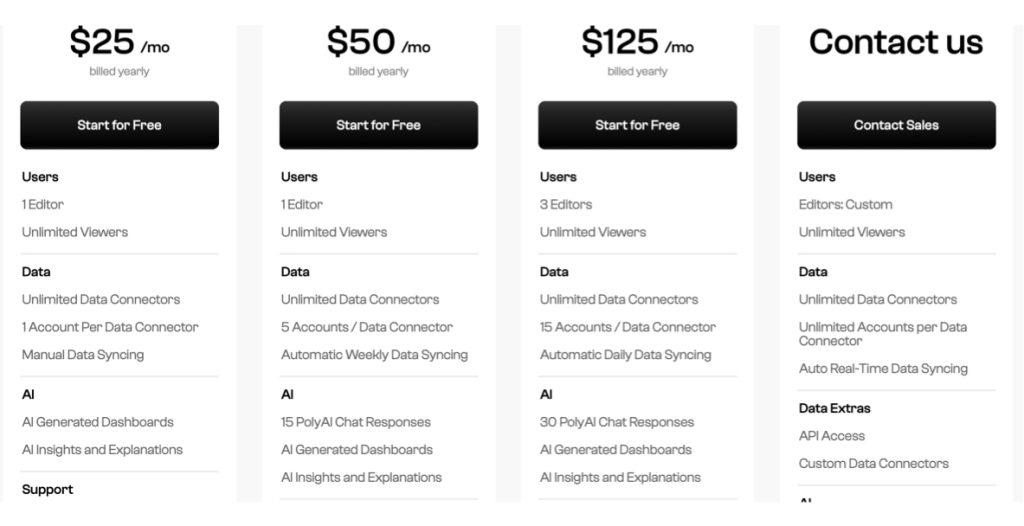
Pricing
Here’s how storytelling with data typically works:
- Identify your audience. To craft an impactful data story, it’s crucial to understand who constitutes your audience and tailor the narrative to their interests, industry niche, and comprehension level. Delving into audience analysis is key. If you haven’t yet developed a user persona, now is the opportune moment, as it is instrumental in pinpointing your ideal customer.
- Define your message: Identify the key message or insight you aim to convey through your data story. This is about intent, and your narrative should be streamlined to communicate one primary message.
- Choose the right visualizations. Not every visual is created equal when it comes to charts and graphs. Choose the most effective visual representation to convey your data clearly. While I personally find scatter graphs less appealing, it’s essential to consider whether a straightforward pie or bar chart could more effectively simplify the information.
- Create a narrative. Craft a storyline that navigates the audience through the data, spotlighting key points and insights. A compelling story includes an introduction, a conflict, and a resolution. In data storytelling, your introduction will likely summarize the existing problem to set the stage.
- Proposed solutions. Discuss your current strategies for problem-solving, such as initiatives to boost sales, penetrate new markets, or gain an edge over competitors. What’s the solution? A thorough data review that leads to actionable takeaways, setting the stage for next steps and defining clear goals.
- Engage your audience. Use storytelling techniques with compelling visuals and anecdotes.
The art of storytelling with data lies in the ability to transform complex data into a compelling story that resonates with the audience, ensuring their understanding.